


Velocity time integral (VTI), also called stroke distance, is an ultrasound measurement that can help the emergency medicine provider guide both differentials and treatment.
Here we will focus on its role in guiding volume replacement--which can be applied to many situations - and one such application that is easily conceptualized is the septic patient. The non-invasive measurement of cardiac output has been a goal of physicians from many disciplines for decades. It may be of particular and timely importance to those engaging in active resuscitation. The Surviving Sepsis campaign has suggested 30 mL/kg as an initial volume replacement goal for septic and septic shock patients, but thereafter the guidance is much less clear.1
VTI can fill this gap. To understand VTI let’s revisit some fundamental equations of physiology and even wade back into geometry. The goal of volume resuscitation is to optimize cardiac output to maximize the patients' ability to perfuse their end-organs.
Cardiac output (CO) can be defined as:
CO = Stroke volume (SV) * Heart rate (HR)
Measuring HR is easy enough. One can palpate a pulse, use pulse oximetry, or use any number of reliable approaches to measuring this variable. Measuring SV is not as simple. SV can be rewritten as:
SV = end diastolic volume (EDV) – end systolic volume (ESV)
Conceptually this makes sense; the volume that is missing after the ventricle squeezes out what it will represents the SV. This volume is propelled by the left ventricle into the aorta — a cylinder-like structure.
VTI treats the aorta as a rigid cylinder, which is not a perfect assumption but allows for a very near approximation of the volume that has moved from the ventricle into the aorta. The volume of a cylinder is calculated by:
Volume of cylinder= surface area of one of the ends * length
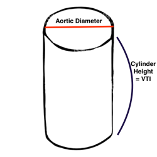
To approximate the surface area of the end of our conceptual cylinder—in the long axis echocardiogram view visualize the proximal aorta, and by measuring the internal diameter of the proximal aorta—at the level of the visible leaflet cusps (the right coronary and non-coronary cusps)—you get the diameter of the circular base to the cylinder—halve the diameter to get the radius.
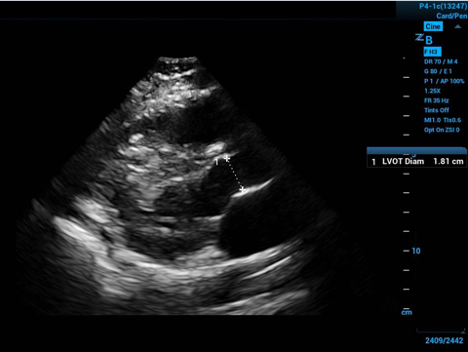
Figure 2. Left ventricular outflow tract diameter measured in parasternal long axis
The measurement should take place mid-systole (aortic leaflets open on screen) due to the distensibility of the muscular aorta. Then apply some simple geometry:
Area of a circle=pi*radius2
Now you have the area of the cylinder base, so then you need the height (or length) of the cylinder to finish getting the volume. The volume ejected by the left ventricle goes through the opening for which you have calculated the surface area as above, and all you need now is to calculate how far it goes - then you will have the cylinder height. Unfortunately, this volume does not have a uniform distance or velocity, so it isn’t a simple measurement. Instead, the ultrasound software gives a calculated average because some of the blood is ejected more quickly and far, but the last bit may be moving slowly and not go far at all into the descending aorta.
VTI works by placing the ultrasound’s sample volume within the LVOT and using pulse wave doppler to sense the velocity of the blood moving through the LVOT. To get this view you use the apical 5-chamber view to visualize the LVOT.
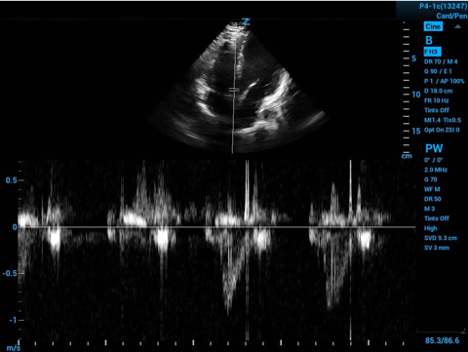
Figure 3. Spectral doppler gate placed in the LVOT with velocity curve below
This is displayed as a spectrum of LVOT flow velocity through time. The ultrasound will plot the velocity over time at this point in the LVOT as seen in the bottom of Figure 3 above.
Now the ultrasound software spares you the integral calculus work to give you the area under the curve after you help by tracing the curve.
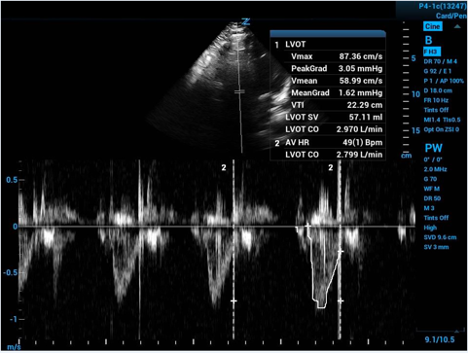
Figure 4. Tracing of velocity curve with calculated cardiac output
The machine derives the average velocity in the LVOT throughout a cycle of systole. With a velocity and an amount of time you can calculate a distance—and then you have the height of your cylinder!
Multiplying VTI (cylinder height) by our calculated cylinder base surface area we have stroke volume, and multiplying this by a HR you finally have the elusive CO. Dividing by patient body surface area and you can have cardiac index.
Stroke (cylinder) volume= surface area of base (aortic opening) * height (VTI)
Getting back to our scenario of guiding volume resuscitation in sepsis and septic shock—serial measurement of VTI can tell you when a patient no longer has increased cardiac output with more volume delivered. This can be assessed either with before-and-after VTI measurements surrounding a 500 mL bolus of crystalloid fluid or even more exciting—after a passive leg raise to simulate a 500 mL bolus. By performing a passive leg raise you can simulate a 500mL bolus of volume and see if your patients can increase their cardiac output without having the negative effects of giving the bolus and finding that their left ventricle can no longer handle more volume.2
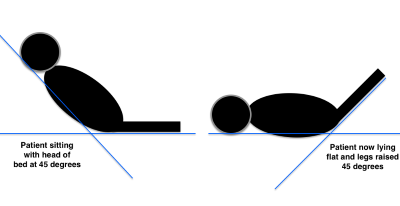
Figure 5. Passive leg raise procedure2
VTI measurements are highly repeatable.3,4 The calculated CO corresponds well with more invasive measures of CO that are considered the gold standard of CO measurement.5 Best of all, emergency medicine providers are well suited to obtain this measurement and can do so reliably.6,7 All of this together suggests that we, as resuscitation experts, should and can use VTI to guide our decision of who can use more volume to improve CO.
References
- Rhodes A, Evans LE, Alhazzani W, et al. Surviving Sepsis Campaign: International Guidelines for the Management of Sepsis and Septic Shock: 2016. Crit Care Med. 2017;45:486552.
- Monnet X, Rienzo M, Osman D, et al. Passive leg raising predicts fluid responsiveness in the critically ill. Crit Care Med. 2006;34(5):1402-1407.
- Lewis JF, Kuo LC, Nelson JG, Limacher MC, Quinones MA. Pulsed Doppler echocardiographic determination of stroke volume and cardiac output: clinical validation of two new methods using the apical window. Circulation. 1984;70(3):425-431.
- Bergenzaun L, Gudmundsson P, Öhlin H, et al. Assessing left ventricular systolic function in shock: evaluation of echocardiographic parameters in intensive care. Crit Care. 2011;15(4):R200.
- Lefrant JY, Benbabaali M, Ripart J, et al. CO assessment by suprasternal Doppler in critically ill patients: comparison with thermodilution. Intensive Care Med. 2000;26(6):693-697.
- Dinh VA, Ko HS, Rao R, Bansal RC, Smith DD, Kim TE, Nguyen HB. Measuring cardiac index with a focused cardiac ultrasound examination in the ED. Am J Emerg Med. 2012;30:1845-1851.
- McGregor D, Sharma S, Gupta S, Ahmad S, Godec T, Harris T. Emergency department non-invasive cardiac output study (EDNICO): a feasibility and repeatability study. Scand J Trauma Resusc Emerg Med. 2019;27(1):30.