


Asthma is a common complaint among patients presenting to emergency departments, with approximately 2 million ED visits annually for asthma exacerbation in the United States alone.1 The most common method of assessing the degree of exacerbation and rate of deterioration or improvement is either subjectively via a physical exam or objectively with a peak expiratory flow rate (PEFR). Both of these methods have their weaknesses. Auscultation of the lungs has been shown to have poor both interobserver and intraobserver reproducibility.2 Peak flow measurements are effort-dependent and if not explained or performed properly can lead to incorrect results. Because of the lack of an objective, reproducible, effort-independent measure of the severity of exacerbation, some clinicians have looked at capnography as a possible alternative.
Evolution of Capnography
Capnography has been used by anesthesiologists for almost 40 years. Over the past 2 decades it has developed an important role in the ED as well; among other indications, it is now routinely used for confirming endotracheal tube placement, assessing quality of cardiac compressions, monitoring for respiratory depression during sedation, and more.3,4
The benefit of capnography over capnometry is that instead of just displaying the end tidal carbon dioxide (CO2) in exhaled air, it provides a waveform of CO2 expired over time, referred to as a capnogram. In a patient with normal lung physiology, the capnogram has a pattern that resembles rectangles, or a “top hat” morphology, and can be separated into inspiratory and expiratory components (Figure 1).
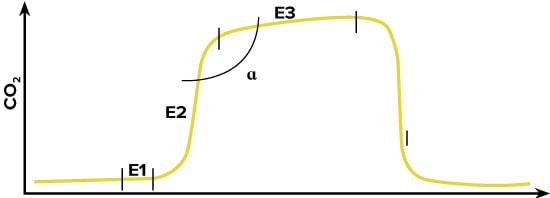
FIGURE 1. Normal Capnogram
Inspiration begins with a rapid decrease in CO2 followed by a consistent low level that correlates with the concentration of CO2 in the atmosphere. Expiration consists of three separate phases:
- Phase E1 correlates with expiration of dead space air, during which time the CO2 level does not rise since dead space air did not undergo air exchange in the lung.
- Phase E2 resembles the expiration of mixed air; if there is no obstructive physiology, a regular separation front between dead space and alveolar air should cause a rapid rise in CO2.
- Phase E3 results from the expiration of alveolar air. If all alveoli are ventilated equally, without a ventilation/perfusion mismatch present, a homogenous partial pressure of carbon dioxide (PACO2) would cause a minimal rise during this phase.4-6 Alpha angle is the designation given to the angle between Phases E2 and E3 and should be about 110 degrees in most healthy individuals.5
In an asthmatic patient, the waveform is altered (Figure 2). Because of varying degrees of bronchoconstriction throughout the lung, there is no regular separation front between dead space air and alveolar air during exhalation, resulting in a more gradual rise of phase E2. This is referred to as desynchronization.6,7 Furthermore, varying bronchoconstriction affects alveolar ventilation, causing “parallel heterogeneity,” with some alveoli having a higher PACO2 than others. This inconsistency triggers a steeper rise of CO2 during phase E3. Together, these result in the opening of the alpha angle, which – if severe enough – can lead to a “shark fin” appearance, where the alpha angle is essentially gone.4,6 (Figure 2)
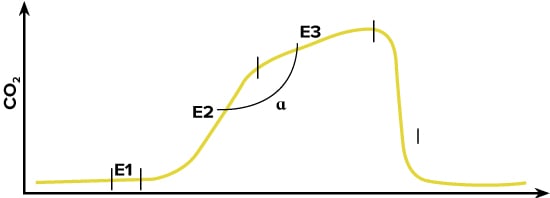
FIGURE 2. Capnogram Resembling Obstructive Physiology
Capnography for Asthma Assessment
Several studies have assessed the utility of capnography in the monitoring of asthmatic patients in the ED. In 1996, a prospective blinded trial of 49 patients found a statistically significant difference in the slope of phase E3 between healthy volunteers and asthmatic patients, and between asthmatic patients pre- and post-treatment. The results also revealed a statistically significant correlation between the slope of phase E3 and PEFR.7 In 2009, a prospective trial of 128 patients being treated for asthma in a university ED setting replicated the results. The study also revealed a statistically significant difference in the slope of phase E3 and alpha angle, but not in phase E2 slope pre- and post-treatment.3,4 These findings have also been shown to hold true in the pediatric population, where this method of monitoring may be the most useful.8
Although these trials were small, they have consistently shown a correlation between the capnography waveform and the patient’s clinical status. Capnography is an objective method of assessment that is noninvasive, effort-independent, can be performed simultaneously while the patient is receiving treatment, and can be used to monitor the patient’s progress in real time.
Although routinely calculating the slopes and angles of capnogram in actual practice is not always practical, visually monitoring the change in waveform can assist in making clinical decisions. For example, the waveform in Figure 3 is of a female in her 40s who presented to the ED with an asthma exacerbation. She was treated with 3 rounds of albuterol with ipratropium via nebulizer over the following hour. (Figure 3)
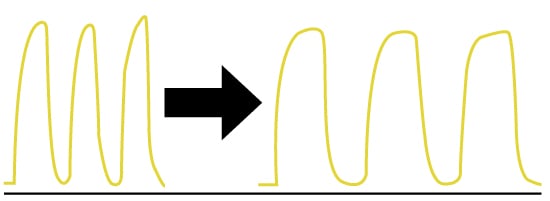
FIGURE 3. Capnography Pre-and Post-treatment of Asthmatic Patient
Although on repeat examination she was still wheezing, she reported improvement in her symptoms, and the capnogram clearly demonstrated a change in morphology from a shark fin pattern into a top hat pattern. As a result, this patient was discharged home with close follow-up with her primary care doctor.
With further advances in capnography technologies, we may have a new and improved method for evaluation of asthma patients.
References
- Asthma FastStats: National Center for Health Statistics. Centers for Disease Control and Prevention. https://www.cdc.gov/nchs/fastats/asthma.htm.
- Pasterkamp H, Wiebicke W, Fenton R. Subjective assessment vs computer analysis of wheezing in asthma. Chest. 1987;91(3):376-381.
- Howe TA, Jaalam K, Ahmad R, et al. The use of end-tidal capnography to monitor non-intubated patients presenting with acute exacerbation of asthma in the emergency department. J Emerg Med. 2011;41(6):581-589.
- Nik Hisamuddin NAR, Rashidi A, Chew KS, et al. Correlations between capnographic waveforms and peak flow meter measurement in the emergency department management of asthma. Int J Emerg Med. 2009;2(2):83-89.
- Rasera CC, Gewehr PM. Association between capnogram and respiratory flow rate waveforms during invasive mechanical ventilation. Int J Biosci Bioche Bioinforma. 2013;3(2):80-84.
- You B, Peslin R, Duvivier C, Vu VD, Grilliat JP. Expiratory capnography in asthma: evaluation of various shape indices. Eur Respir J. 1994;7(2):318-323.
- Yaron M, Padyk P, Hutsinpiller M, Cairns CB. Utility of the expiratory capnogram in the assessment of bronchospasm. Ann Emerg Med. 1996;28(4):403-407.
- You B, Mayeux D, Rkiek B, Autran N, Dang Vu V, Grilliat JP. Expiratory capnography in asthma. Perspectives in the use and monitoring in children. Rev Mal Respir. 1992;9(5):547-552.