


In previous discussions we introduced how using the tricuspid annular plane systolic excursion (TAPSE) can help identify right ventricular (RV) dysfunction in the setting of an acute pulmonary embolism (PE).
TAPSE offers high sensitivity, albeit a relatively lower specificity. This leads to the question: Are there any other ultrasound techniques that can be implemented in conjunction with TAPSE that would help increase the specificity in this clinical scenario? In this discussion, we will explore how the "60/60 sign" can help accomplish this.
The 60/60 sign is made of two measurements: a pulmonary artery systolic pressure (PASP) less than 60 mmHg and a pulmonary acceleration time (PAT) less than 60 milliseconds.
The pathophysiology of PE includes obstruction of pulmonary arteries, which, if significant enough, increases the afterload the RV experiences through higher pressures in the pulmonary arteries. Higher afterload necessitates that the RV generates higher systolic pressures to maintain appropriate RV output. If the RV is unable to accommodate this, patients will experience hemodynamic instability in the form of decreased left ventricle (LV) output, hypotension, and ultimately obstructive shock. The RV is much thinner and lower in muscle mass compared to the LV, thus a significantly higher RV systolic pressure can only be generated if there is a slow increase in the RV afterload allowing for myocardial hypertrophy. If there is a sudden increase in the PASP (>36mmHg but <60mmHg), this can be more reasonably attributed to an acute insult such as a large acute PE. If pressures are >60mmHg, it can be theorized there is a chronic process at play allowing for the RV to accommodate such elevated pressures through slow hypertrophy (although an acute rise can also be present, the 60/60 sign is not created to detect this).1
To measure the PASP (and therefore increased work for the RV) you can employ some of the physical properties of flow. Specifically, a modified Bernoulli equation is used:
▵P = 4V²
This equation allows a pressure to be calculated when a velocity is known. Another consequence of the Bernoulli equation is that the sum of pressure energy and kinetic energy is the same throughout our circulatory system and so we can calculate the pulmonary artery systolic pressure at other places in the right-sided circulation.2 A common consequence of clinically significant PE is RV stretch and tricuspid regurgitation. This tricuspid regurgitation flow is easy to sample and use to calculate our velocity. It must be noted, however, that this sign cannot be used in the absence of tricuspid regurgitation.1
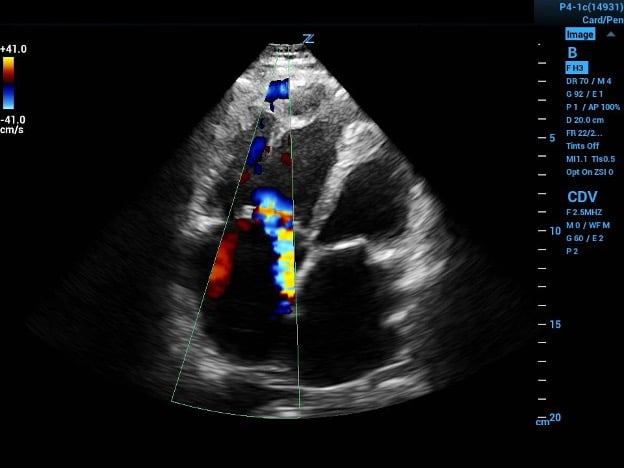
Image 1a (above) and 1b (below)
1a. Four-chamber view with color flow showing eccentric tricuspid regurgitation jet directed at interatrial septal wall.
1b. The continuous wave Doppler gate placed in the jet path and the resultant velocity tracing. When placed in the equation results with a PASP of 101mmHg, indicating probable longstanding increased RV pressures.
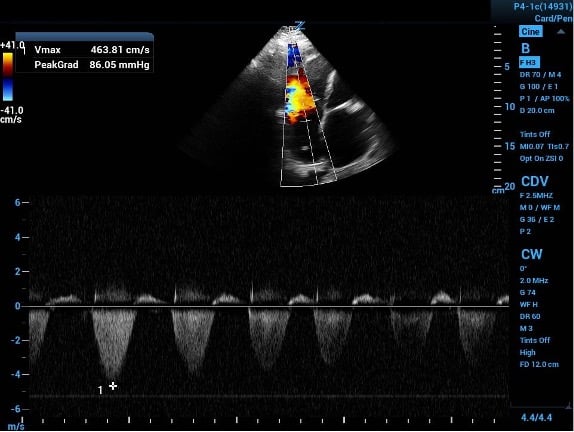
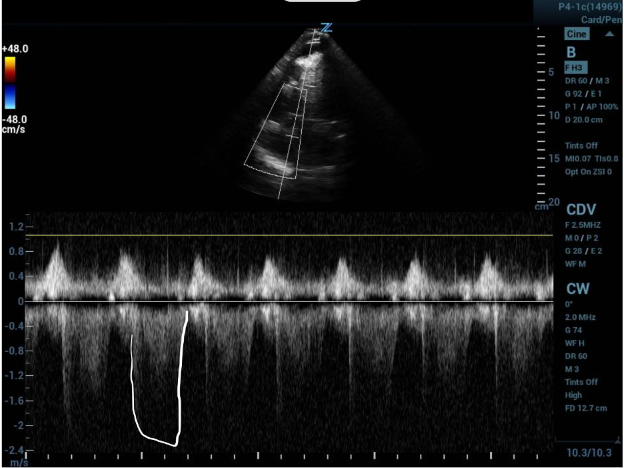
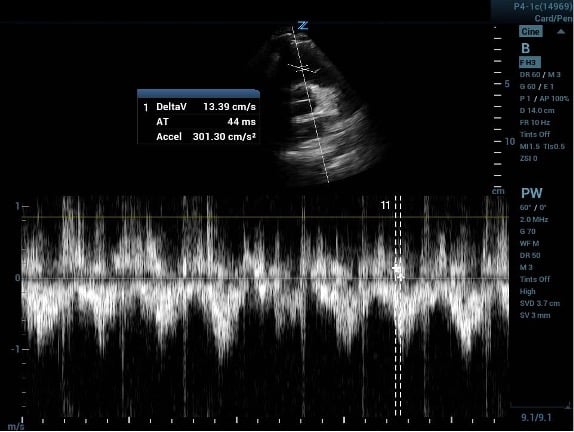
Image 2: A tricuspid regurgitation jet velocity tracing with off-axis placement of sampling gate leading to weak outline of velocity curve. The second curve is outlined showing the true tracing with appropriate gate placement.
In a standard 4-chamber view, place color flow sampling in the right atrium (RA) behind the tricuspid valve to look for regurgitant flow. If a regurgitant jet is present, place the continuous wave doppler sampling gate within and parallel to the jet. Precise parallel placement is required for accurate values, and color flow is useful to detect eccentric jets and overall flow direction. Off-axis placement of the sampling gate can lead to falsely low velocities and waveforms with weak or jagged outlines (as in image 2).
The continuous wave output will be a velocity. For this measurement use the maximum velocity. Either allow your ultrasound machine to do the calculation for you or plug it into the equation above to get a pressure. Averaging three or more values can improve accuracy.1, 3
The pressure that is obtained through this measurement and/or calculation will serve as the tricuspid regurgitation gradient. This value is a measurement of pressure across the tricuspid valve and because it is working against the central venous pressure (CVP) it does not represent the PASP. Pressure is a scalar quantity and so to find the PASP we can add the tricuspid regurgitation gradient to the CVP.1, 3
In the non-intubated patient, the CVP can be estimated based on the size and variability of the IVC throughout the respiratory cycle (CVP can be transduced from a central catheter in intubated patients).
|
CVP (mmHg) |
IVC Size (CM |
% Collapse with inspiration |
|
3 |
<2.1 |
<50 |
|
8 |
<2.1 |
50+ |
|
2.1+ |
<50 |
|
|
15 |
2.1+ |
50+ |
Adding the estimated CVP to the tricuspid regurgitation gradient calculated gives you the PASP we have been looking for. The upper limit of normal for this value is 36 mmHg, and values above this are considered elevated. Elevated values up to 60 mmHg are suggestive of acute increases in PASP, and as previously discussed, values above 60 mmHg are more reflective of a chronic process that allowed for the RV to slowly hypertrophy.1, 3
Now on to the PAT. This measures how quickly it takes for flow out of the RV to reach maximal velocity during a cardiac cycle. PAT is shorter when afterload (pulmonary vascular resistance) is higher – like in PE. Normal PAT is >130msec, while a PAT of <60msec reflects a markedly abnormal acceleration time.3
To measure PAT, first obtain a short axis view of the LV. Then sliding the probe cephalad, obtain a view of the aortic valve (the Mercedes sign). The RV outflow tract will be visible coursing over the aortic valve. Place a pulse wave doppler gate just inside of the pulmonic valve to generate a velocity curve. Now measure the time from beginning of flow to the peak velocity. It may be easier to identify the peak if you increase the sweep speed (stretch the tracings).1, 3
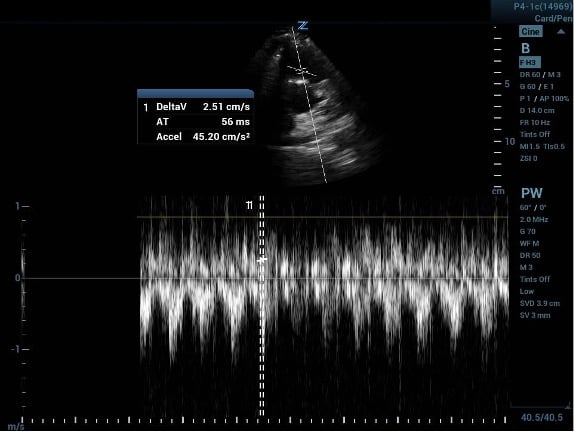
Image 3a (above) and 3b (below)
PAT measured before and after increasing the ultrasound machine sweep speed.
If your calculated PASP is <60 mmHg and your measured PAT is <60msec then the 60/60 sign is positive and there is a high likelihood that PE is present. In fact, a validation study was done with the 60/60 sign and found that it was 94% specific at identifying PE.4
Unfortunately, one of the major pitfalls of using the 60/60 sign is that it has a low sensitivity (as low as 25%) and thus cannot be used alone to rule out an acute PE. Additionally, PASP can be inaccurate in the setting of tricuspid stenosis and PAT can similarly be affected by pulmonary valve stenosis (and regurgitation for that matter). PAT can also be more difficult to interpret at extremes of heart rates.4, 5
TAKE-HOME POINTS
- The 60/60 sign is worth knowing and practicing due to its ease of acquiring, its attractive specificity, and its ability to be paired with other ultrasound assessments.
- Some patients are not stable enough to be taken to the CT scanner, and a bedside assessment can help direct clinical decisions.
- The 60/60 sign is quite specific, and when paired with other ultrasound findings like TAPSE, McConnell's sign, RV:LV ratio, and septal flattening, this measurement can become quite powerful to aid in the diagnosis of a clinically significant, acute pulmonary embolism.
REFERENCES
- Parasuraman S, Walker S, Loudon B, et al. Assessment of pulmonary artery pressure by echocardiography—A comprehensive review. Int J Cardiol Heart Vasc. 2016;12:45-51.
- Rawshani A. The Bernoulli Principle and Estimation of Pressure Gradients. ECG & ECHO Learning. Nov. 24, 2019. Accessed Oct. 24, 2022.
- Kurzyna M, Torbicki A, Pruszczyk P, et al. Disturbed right ventricular ejection pattern as a new Doppler echocardiographic sign of acute pulmonary embolism. Am J Cardiol. 2002;90(5):507-11.
- Kurnicka K, Lichodziejewska B, Goliszek S, et al. Echocardiographic Pattern of Acute Pulmonary Embolism: Analysis of 511 Consecutive Patients. J Am Soc Echocardiogr. 2016;29(9):907-13.
- Shah BR, Velamakanni SM, Patel A, Khadkikar G, Patel TM, Shah SC. (2021). Analysis of the 60/60 Sign and Other Right Ventricular Parameters by 2D Transthoracic Echocardiography as Adjuncts to Diagnosis of Acute Pulmonary Embolism. Cureus. 2021;13(3):e13800.